You can't grow what you can't measure
Many businesses in Nepal sell every day without clearly knowing:
- Which channel is making money
- Which product is actually profitable
- Which staff member performs better
- Which city orders more
- Which campaign works
- How much profit they really make
Instead, they rely on rough guesses, manual Excel sheets, end-of-month calculations and partial data.
Blanxer analytics replaces that with live numbers from your own orders, bills and stock. The built-in dashboard gives you the business overview. For deeper marketing attribution and visitor behaviour, add Google Analytics and Microsoft Clarity as well.
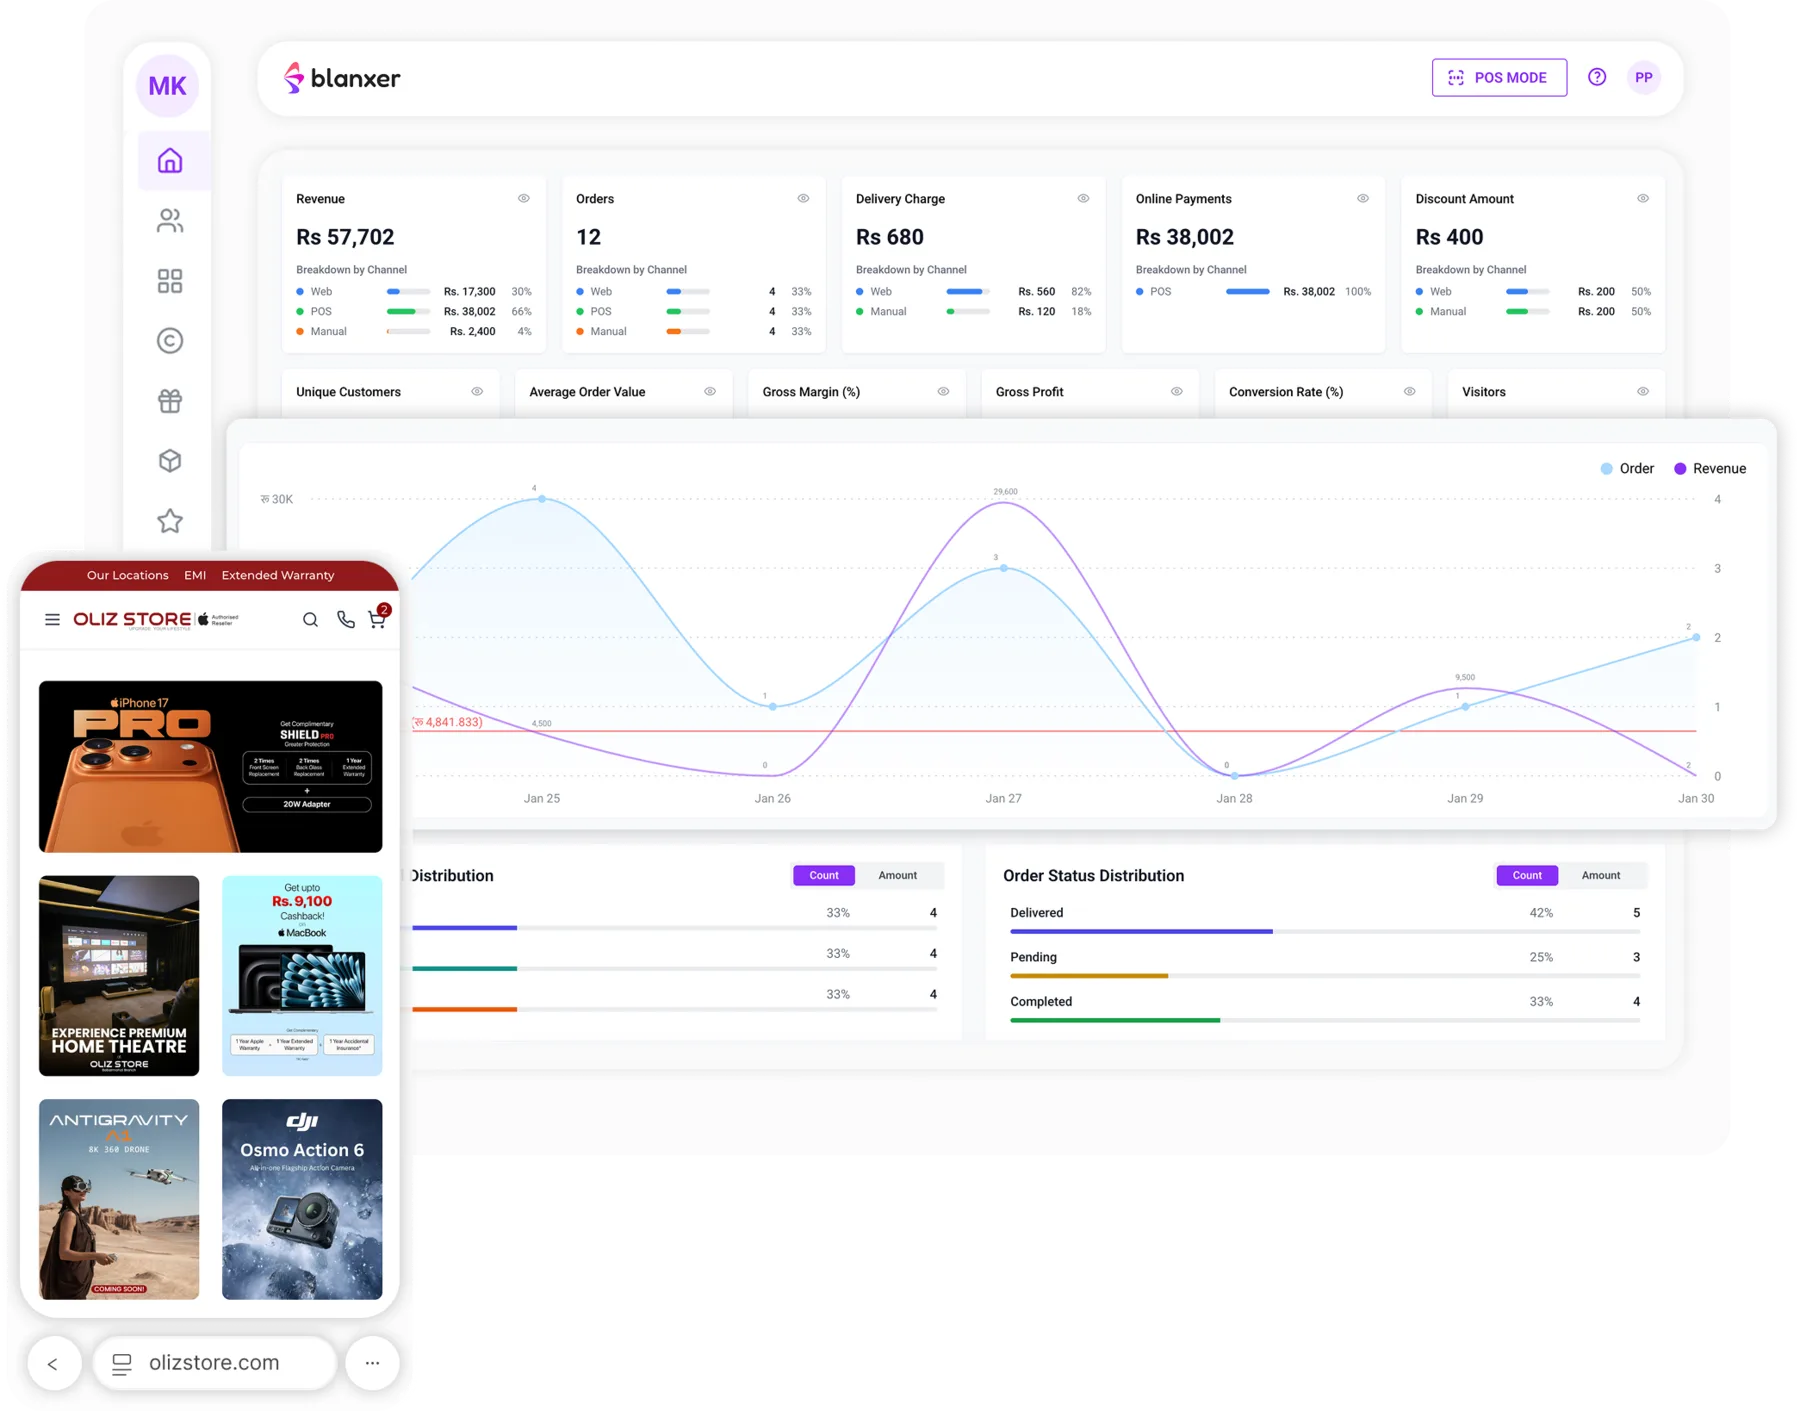
A sales dashboard built for real business decisions
Blanxer analytics is not a basic sales report. It is a real-time reporting system built for Nepali ecommerce, retail stores, businesses that sell both online and offline, cash-on-delivery markets and multi-outlet businesses. Everything is connected in one dashboard.
Live revenue and order tracking
With Blanxer you can see at a glance:
Total revenue
Across every channel.Order count
How many orders came in.Delivery charges collected
What customers paid for delivery.Online payments received
Money received by QR and online payment.Discount usage
How much your offers cost you.Gross profit and margin
Gross profit in rupees and as a percentage.
No waiting until month end and no exporting CSV files. Everything updates in real time.
Sales by channel: website, POS and manual orders
Most businesses sell through several channels: the website, a physical store (POS), and manual orders taken over DMs and phone calls. Blanxer separates revenue by channel automatically, so you know:
- How much came from the website
- How much came from POS
- How much came from manual orders
That helps you identify your strongest channel, spend your marketing budget where it works and scale what is working.
POS sales appear here when you bill at the counter with Blanxer POS, which is part of the Platinum plan.
Conversion rate tracking for Facebook and TikTok ads
Blanxer shows three numbers side by side: visitors, orders and conversion rate.
This is especially useful for Facebook ads, TikTok ads, influencer traffic and organic campaigns. You can see immediately:
- Is my traffic converting?
- Is my checkout performing?
- Is my offer working?
If traffic arrives but does not convert, the checkout is the first place to look; our checkout guide explains what to fix, and the Facebook ads guide covers campaign structure.
Top cities and delivery areas
Blanxer shows you:
- Which cities order the most
- Order volume by location
- Revenue by delivery area
This helps businesses:
- Focus ads on high-performing regions
- Plan delivery routes
- Plan warehouse expansion
- Create city-based campaigns
Growth decisions come from data instead of guesses. Pair this with courier integrations to see where your deliveries go and how they end.
Product performance: best sellers and slow movers
Blanxer tracks automatically:
- Top-selling products
- Least-selling products
- Revenue contribution per product
- Quantity sold
- Profit impact
This lets you:
- Drop slow-moving products
- Double down on winners
- Adjust pricing
- Improve inventory planning
Decisions are backed by data rather than instinct. Stock value and movement are covered in more depth in our inventory management software overview.
Gross profit and margin tracking
Most Nepali sellers track only sales, not profit. Blanxer calculates:
- Gross profit
- Gross margin percentage
- Cost-based profit analysis
This helps you understand:
- Which product makes money
- Which product only creates volume
- Which offers are profitable
Profit needs a cost price
Profit figures are only as accurate as the cost you record. Add a buying cost to each product (the your_buying_cost column in bulk product upload), and on Platinum use batch tracking so different purchase prices give a weighted average cost. See the POS and inventory guide.
Profit visibility is what separates small sellers from businesses that can scale.
Staff performance reports
For teams and growing operations, Blanxer tracks:
- Orders created by each staff member
- Successful deliveries
- Revenue generated
- Each person's contribution to performance
This helps you:
- Reward high performers
- Identify training gaps
- Prevent internal inefficiencies
- Manage teams transparently
No manual staff reporting required.
Order status distribution
Blanxer shows your order pipeline in real time: pending, delivered, completed and failed.
That gives you instant visibility into fulfilment speed, delivery bottlenecks and operational efficiency. Operations become measurable.
Reports for multi-outlet businesses
If you have multiple stores, multiple warehouses or different fulfilment locations, Blanxer analytics works across all outlets. You can filter by:
- Outlet
- Date range
- Category
- Product
- Location
That is detailed reporting without enterprise complexity. Multiple outlets are part of the Platinum plan.
Replace your sales spreadsheets
Before Blanxer, a typical business kept:
- Sales in one file
- Inventory in another
- POS software separately
- A separate courier portal
- A separate payment portal
Now everything lives in one system:
- Orders
- POS
- Payments
- Inventory
- Logistics
- Staff actions
One dashboard, one set of numbers.
Designed for decision makers, not just accountants
Blanxer analytics is designed so that:
- Business owners understand it instantly
- Managers act faster
- Teams stay aligned
- Growth becomes predictable
No accounting degree required, just clear dashboards.
Real-time data means faster growth
When you can see what sells, what converts, what makes a profit and what fails, you stop guessing and start scaling.
Why analytics is no longer optional
In ecommerce and retail today, data decides who grows. If you don't track your business, a competitor who does will outgrow you. Blanxer gives Nepali businesses the same kind of reporting that large brands rely on:
- Real-time dashboards
- Channel-wise performance
- Profit tracking
- Conversion analytics
- Staff performance reports
See what each plan includes on the pricing page, or book a demo below and we'll walk you through the dashboard with your own kind of business in mind.